New Danville superintendent looks to improve test scores, RTI
Published 6:08 am Tuesday, July 17, 2018
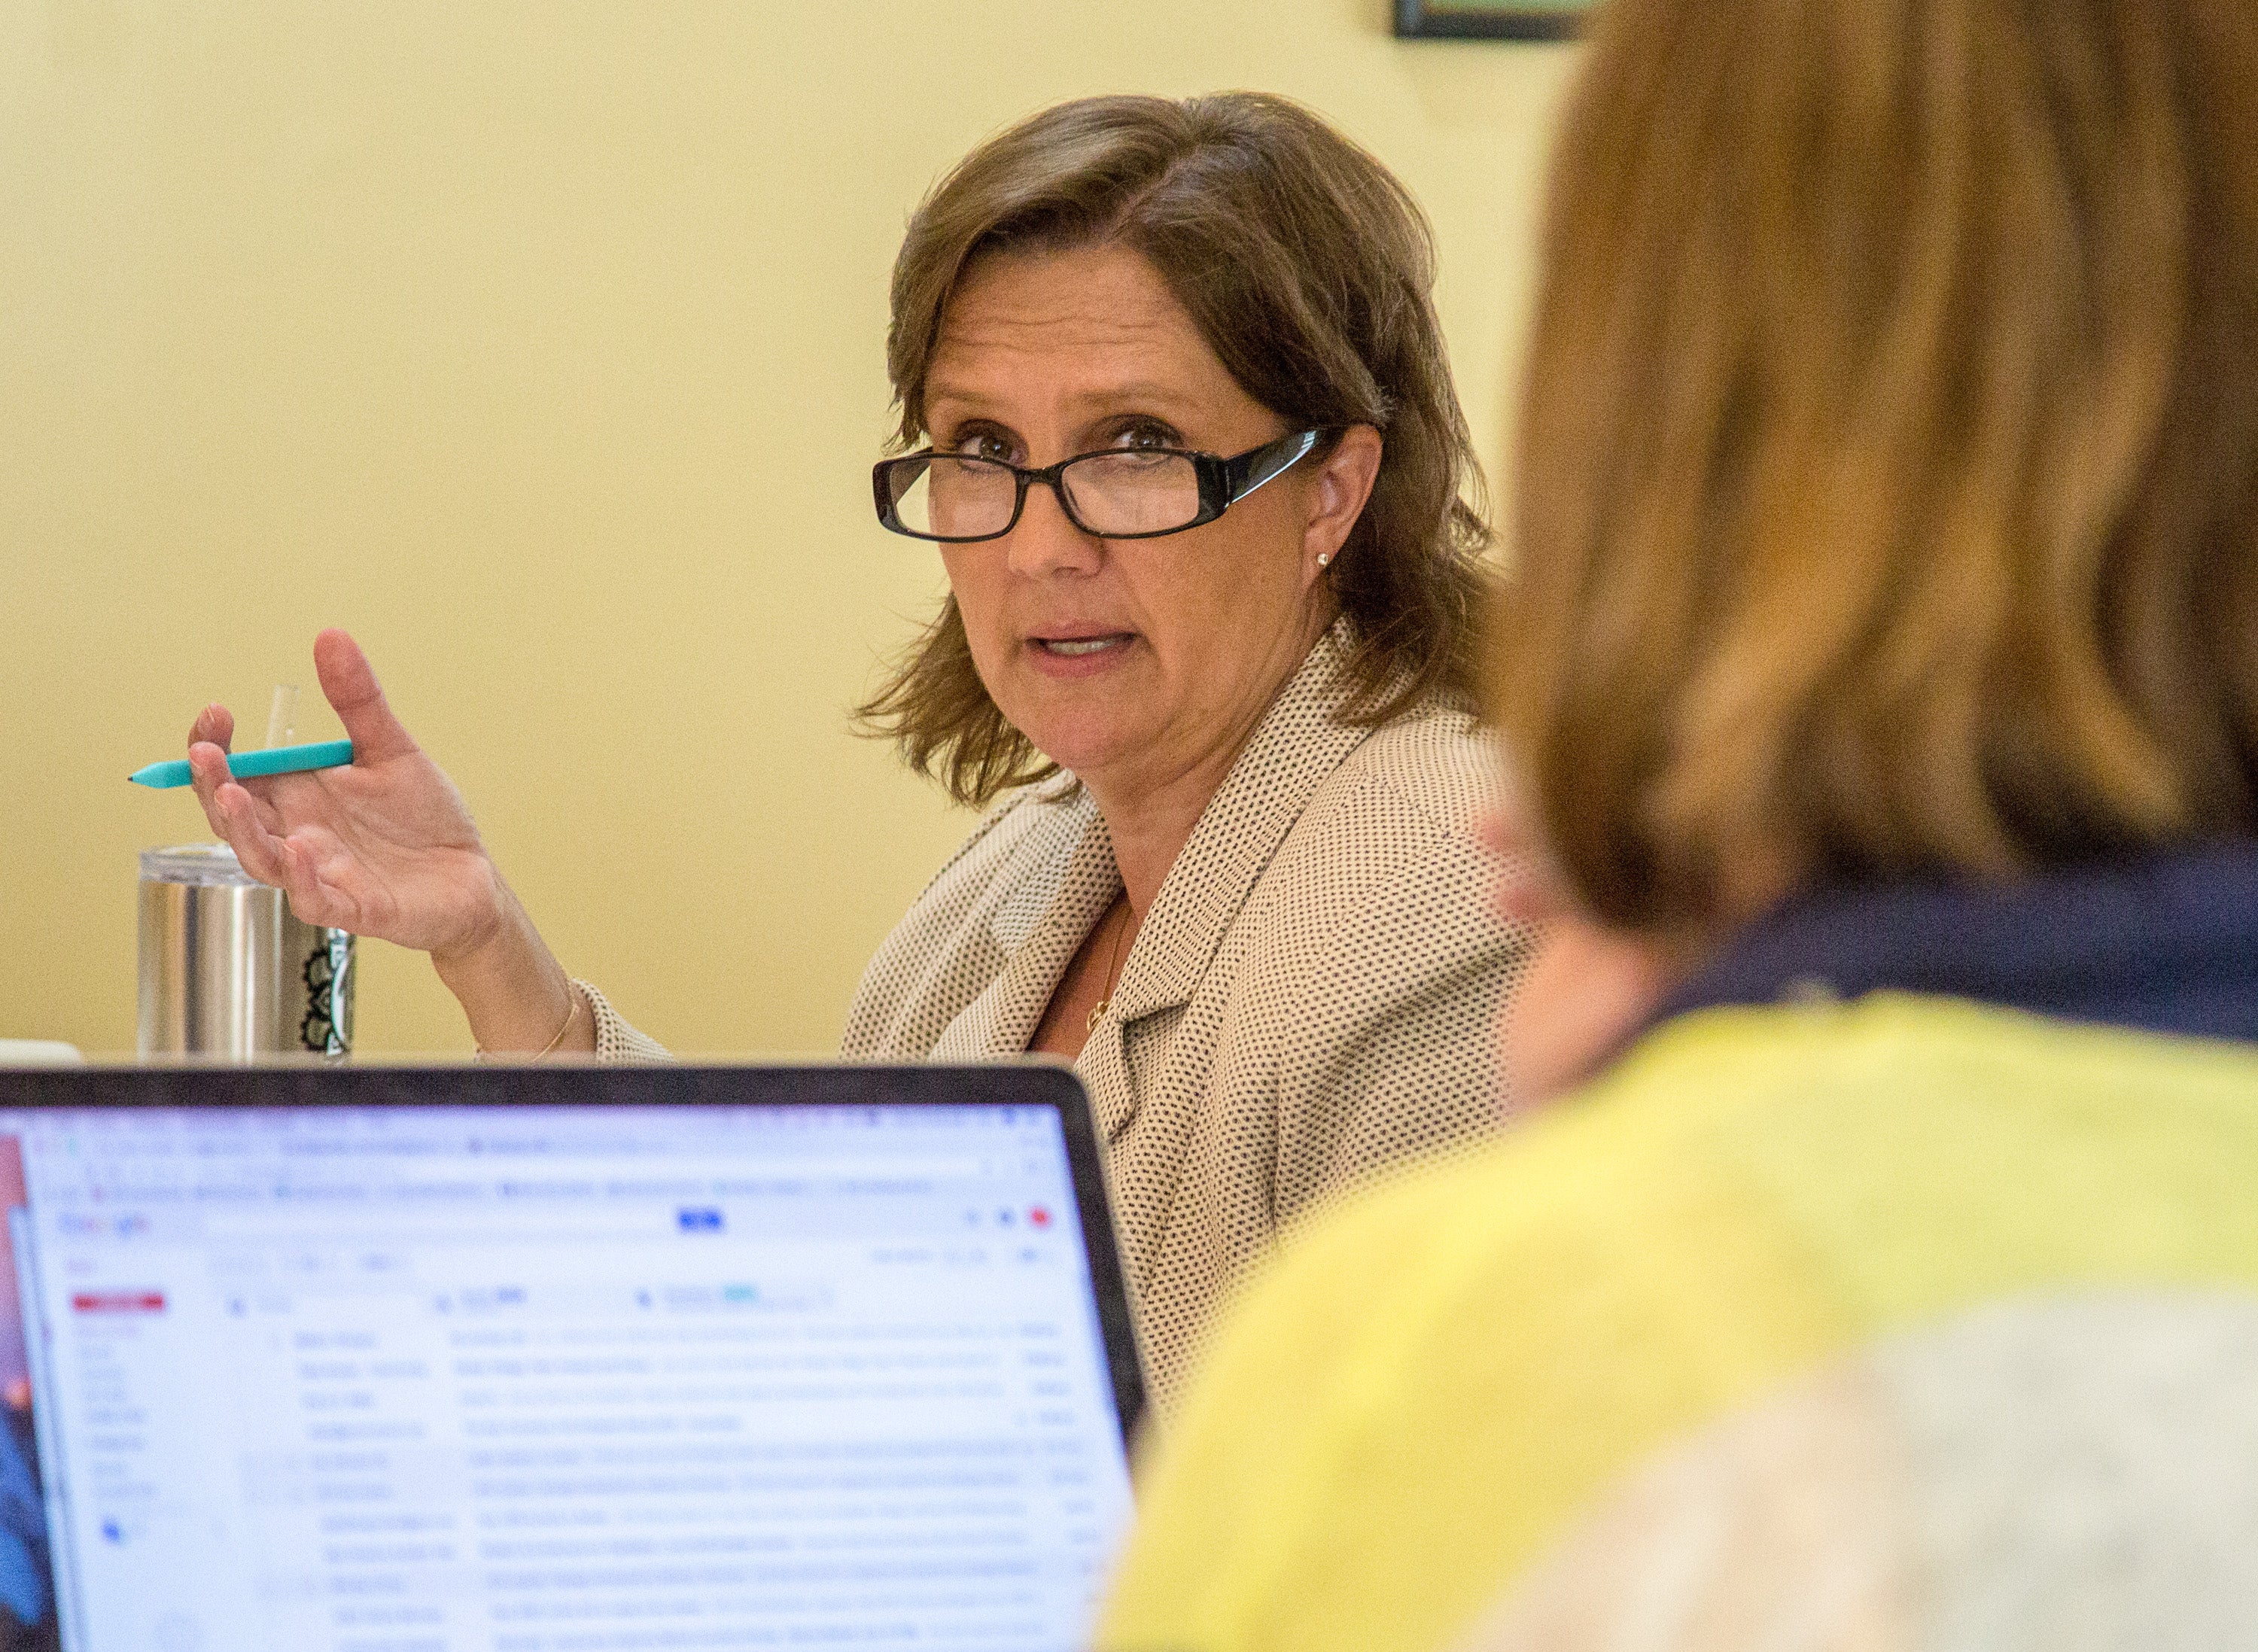
- Ben Kleppinger/ben.kleppinger@amnews.com Danville Schools Superintendent Tammy Shelton speaks during a special called meeting of the Danville Board of Education Monday morning.
Newly hired Superintendent Tammy Shelton participated in her first Danville Schools Board of Education meeting Monday morning, about two weeks after she started working for the district.
Shelton brought with her to the meeting plans for slightly modifying the school’s organizational chart and data on district test scores that suggest there’s room for Danville to improve.
Shelton said while 2018 school data is not yet available from the state, she went back and looked at Danville’s 2017 data — the same data board members reviewed in the fall of 2017.
While all the information board members were given is “100-percent accurate,” Shelton said looking at the data in a different way may seem to “contradict” the impressions board members may have had.
“When you get results from the state, it’s reported out many ways. You can look at pieces. It’s very difficult to pull it all together,” she said.
While there’s more digging and “getting in the weeds” to be done that will reveal more insights, Shelton said she decided to initially compare Danville’s Kentucky Performance Rating for Educational Progress (K-PREP) scores in eight areas to the state average, as well as two districts with relatively similar sizes and demographics.
Instead of looking at nearby or rival districts, she chose Bardstown Independent and Bowling Green Independent, both of which have comparable minority populations and free-and-reduced lunch percentages, among other things.
Shelton presented the following findings to board members:
• Danville’s scores for third- to fifth-grade reading, sixth- to eighth-grade reading, third- to fifth-grade math, sixth- to eighth-grade math, English II in high school, algebra III, biology and U.S. history were all below the state average.
• Danville students scored lower on all of the same categories than students at Bowling Green Independent.
• Danville students scored lower in the reading categories and in third- through fifth-grade math than students at Bardstown Independent.
• Danville students scored higher than Bardstown students in sixth- to eighth-grade math.
• Reliable scores were not available for Bardstown’s high school categories.
• Danville spends $12,969 per student per year; Bardstown spends $11,883 and Bowling Green spends $10,760.
• Danville averages a 19.6 on the ACT; the state average is 19.8, Bardstown’s is 20.3 and Bowling Green’s is 21.
“Academics is an area that we need to think about and we probably need to spend more time digging down into the weeds with our data,” Shelton said. “So when we get our 2018 data back … we want to highlight areas where we’ve seen movement, even if it is a 2-percent movement, we need to celebrate that. And there was some movement last year. So those are some things that you see in this report, and we definitely need to celebrate those …
“But we also have to I think be really realistic about the fact that (at) 2 percent a year, it’s going to be a long time before we’re able to get our students caught up and where they need to be to be successful after high school.”
Board member Steve Becker said he thinks Shelton’s comparison shows that the board will have to take responsibility for “how we are directing our dollars.”
“The more we pour into direct classroom services … it’s going to be the big payoff. It may not be fast,” he said. “… We do need to with a fine-tooth comb see where we are spending our money and where we don’t have to spend our money, and allocate those funds immediately into academic problems or challenges.”
Shelton said she believes the district needs to “target very specific areas” where the most improvement can be made, in order to maximize gains from the efforts.
Shelton said the school board has already done some things that will help Danville improve its performance, including the school reorganization from three elementary schools to one primary and one intermediate school beginning this coming school year.
“The restructure in itself is going to make a big difference for teachers to be able to collaborate with each other,” she said.
Shelton said it’s also important to implement robust “response to intervention” or RTI programs. Students who are not just struggling with their grade-level content but actually have “skills deficits” need RTI to help them catch back up; other students who are just struggling with the material need different help in the form of remediation, she said.
Some districts lump those two groups together.
“I think we as a district need to look specifically at what we have in place outside of the core instruction in that general classroom with those teachers,” she said. “What do we have in these other pieces going on to help our students catch up and close some of these gaps that we see?”
Becker said he thinks there are “probably things we’re not doing that we should have been doing.”
“I noticed there are a lot of kids that are just going RTI every year, every year, every year,” he said. “And that’s not the point of RTI.”
Shelton said Becker is “correct,” but it also depends on each situation. A student may be so far behind that they need multiple years of RTI in order to catch up. The trick in those situations is to constantly monitor the student’s progress in order to make sure that even though they are remaining in RTI, the strategies being used to help them catch up are working, she said.
Board member Lori Finke said she feels the board hasn’t been updated regularly about academic performance and asked if Shelton could present more frequently on the schools’ academics.
Shelton said the state data is released once a year, but the school district also collects data that she can present to the board, probably three times a year.
More News Main


SportsPlus
How to Watch MLB Baseball on Friday, July 26: TV Channel, Live Streaming, Start Times
Today’s MLB slate has several top-tier games, including a matchup between the Cleveland Guardians and the Philadelphia Phillies.…
How to Watch the Reds vs. Rays Game: Streaming & TV Channel Info for July 26
The Cincinnati Reds and Rece Hinds hit the field at Tropicana Field against Randy Arozarena and the Tampa…
Reds vs. Rays: Betting Preview for July 26
When the Tampa Bay Rays (52-51) and Cincinnati Reds (49-53) match up in the series opener at Tropicana…
Tennessee Titans vs. Los Angeles Chargers Week 10 Tickets Available – Sunday, November 10 at SoFi Stadium
On Sunday, November 10, 2024, the Los Angeles Chargers (0-0) and the Tennessee Titans (0-0) clash at SoFi…
Tennessee Titans vs. New England Patriots Week 9 Tickets Available – Sunday, November 3 at Nissan Stadium
On Sunday, November 3, 2024, the New England Patriots (0-0) go head to head with the Tennessee Titans…
